The goal of this article is to create a machine learning model (random forest) and predict if a flight will be delayed over 15 minutes using Apache Spark.
The steps I am going to perform are:
- Loading the data into Apache Spark
- Reading and processing data with Pyspark
- Creating a Random Forest and predict delayed flights
1. Loading the data into Apache Spark
Spark is an open-source distributed computing system that operates on a set of computers that allow parallelization of tasks.
Spark MLib is a distributed machine learning framework that runs on the Spark core.
In this case, i will use this framework to create a random forest using Python and a specific library to use in Spark (Pyspark).
Our work environment includes a cloudera virtual machine with an Apache Spark system ready-to-use.
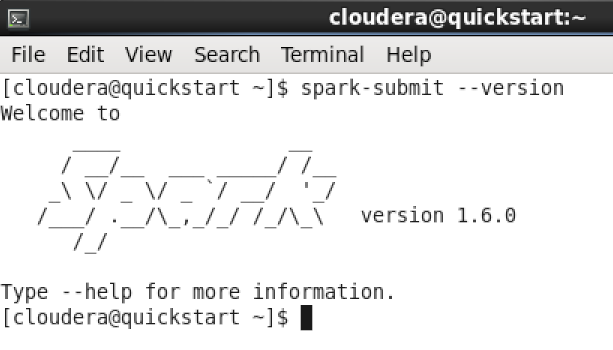
First, I check spark version.
I create a new folder (fligths) in HDFS (Hadoop Distributed File System) and upload a csv file (On_Time_2107_8.csv) from local.
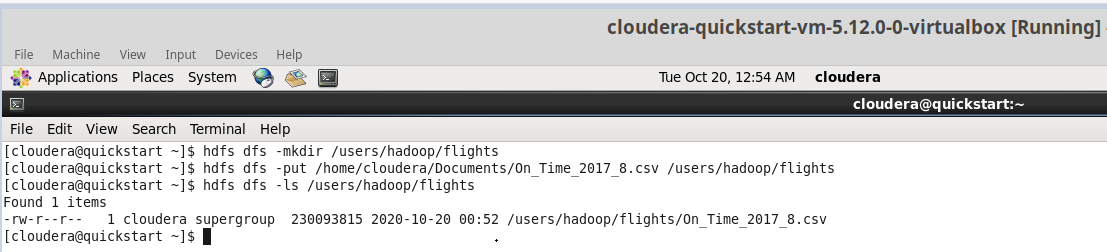
The file includes information about 500.000 flights of U.S. air carriers in august 2017.
You can see detailed information in this link:
https://www.transtats.bts.gov/fields.asp?Table_ID=236
2. Reading and processing data with Pyspark
Using a Jupiter Notebook, you can read the csv file from HDFS
bd = sqlContext.read.format(
    "com.databricks.spark.csv").option("header", "true").load("hdfs://quickstart.cloudera/users/hadoop/flights/On_Time_2017_8.csv",
    inferSchema=True)
bd = sqlContext.read.format(
"com.databricks.spark.csv").option("header", "true").load("hdfs://quickstart.cloudera/users/hadoop/flights/On_Time_2017_8.csv",
inferSchema=True)Cancelled and diverted flights are deleted
bd1 = bd.filter((bd.Cancelled == 0)&(bd.Diverted == 0))
bd1 = bd.filter((bd.Cancelled == 0)&(bd.Diverted == 0)) Counting the number of records
bd1.count()
bd1.count()498163
Two new variables are created (delay and time slot)
# DELAY - Flights with Arrival delay greater or equal to 15 min
bd1 = bd1.withColumn('Delayed', (bd.ArrDelay >=15).cast('int')) # Delay =

## TIME SLOT by departure time (using SQL Context)
sqlContext.registerDataFrameAsTable(bd1, "bd1")

bd1 = sqlContext.sql("select *, case \
               when CRSDepTime <= 800 then 1 \
               when 800 < CRSDepTime and CRSDepTime <= 1200 then 2 \
               when 1200 < CRSDepTime and CRSDepTime <= 1600 then 3 \
               when 1600 < CRSDepTime and CRSDepTime <= 2100 then 4 \
               else 1 end as TimeSlot \
               from bd1")
# DELAY - Flights with Arrival delay greater or equal to 15 min
bd1 = bd1.withColumn('Delayed', (bd.ArrDelay >=15).cast('int')) # Delay =
## TIME SLOT by departure time (using SQL Context)
sqlContext.registerDataFrameAsTable(bd1, "bd1")
bd1 = sqlContext.sql("select *, case \
when CRSDepTime <= 800 then 1 \
when 800 < CRSDepTime and CRSDepTime <= 1200 then 2 \
when 1200 < CRSDepTime and CRSDepTime <= 1600 then 3 \
when 1600 < CRSDepTime and CRSDepTime <= 2100 then 4 \
else 1 end as TimeSlot \
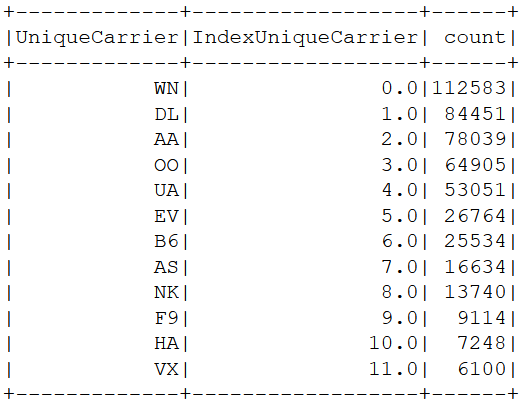
from bd1")Indexing "UniqueCarrier" (from string to numeric)
from pyspark.ml.feature import StringIndexer

indexer = StringIndexer(inputCol='UniqueCarrier',outputCol='IndexUniqueCarrier')
bd2=indexer.fit(bd1).transform(bd1)

bd2.groupBy('UniqueCarrier','IndexUniqueCarrier').count().sort('IndexUniqueCarrier').show()
from pyspark.ml.feature import StringIndexer

indexer = StringIndexer(inputCol='UniqueCarrier',outputCol='IndexUniqueCarrier')
bd2=indexer.fit(bd1).transform(bd1)

bd2.groupBy('UniqueCarrier','IndexUniqueCarrier').count().sort('IndexUniqueCarrier').show()
Select model variables and show the data
bd3=bd2.select('DepDelay',
             'Distance',
             'DayOfWeek',
             'IndexUniqueCarrier',
             'TimeSlot',
             'Delayed')

bd3.limit(10).toPandas()bd3=bd2.select('DepDelay',
'Distance',
'DayOfWeek',
'IndexUniqueCarrier',
'TimeSlot',
'Delayed')
bd3.limit(10).toPandas()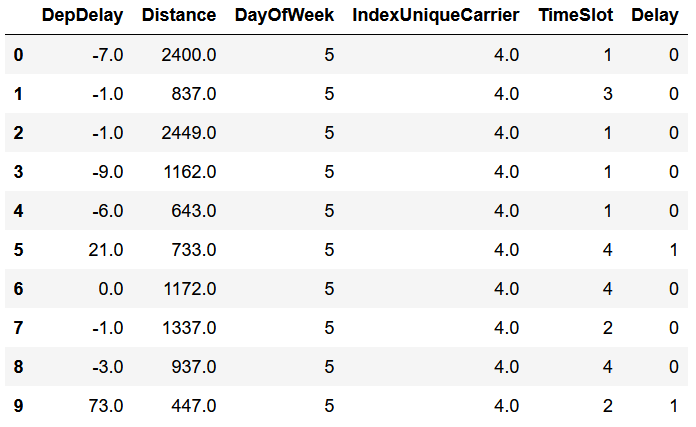
Preparing data for modelling
from pyspark.ml.feature import VectorAssembler, StringIndexer
from pyspark.sql.functions import col

a1 = VectorAssembler(
inputCols=\['DepDelay',
'Distance',
'DayOfWeek',
'IndexUniqueCarrier',
'TimeSlot'\],
outputCol='features')

bd4 = a1.transform(bd3).select(col("Delayed").cast('double').alias("label"),'features')
stringIndexer = StringIndexer(inputCol = 'label', outputCol = 'label2')
sI = stringIndexer.fit(bd4)
bd4 = sI.transform(bd4)
bd4 = bd4.select('label2','features')
from pyspark.ml.feature import VectorAssembler, StringIndexer
from pyspark.sql.functions import col
a1 = VectorAssembler(
inputCols=\['DepDelay',
'Distance',
'DayOfWeek',
'IndexUniqueCarrier',
'TimeSlot'\],
outputCol='features')
bd4 = a1.transform(bd3).select(col("Delayed").cast('double').alias("label"),'features')
stringIndexer = StringIndexer(inputCol = 'label', outputCol = 'label2')
sI = stringIndexer.fit(bd4)
bd4 = sI.transform(bd4)
bd4 = bd4.select('label2','features') Splitting data in train & test
(bd_train, bd_test) = bd4.randomSplit([0.7, 0.3],seed=123)
print('Train:',bd_train.count())
print('Test':,bd_test.count())
(bd_train, bd_test) = bd4.randomSplit([0.7, 0.3],seed=123)
print('Train:',bd_train.count())
print('Test':,bd_test.count())Train: 348737
Test:149426
3. Creating a Random Forest and predict delayed flights
Creating a classification random forest
from pyspark.ml.classification import RandomForestClassifier
from time import time

start_time = time()

# Train a RandomForest model
rf = RandomForestClassifier(labelCol="label",
     featuresCol="features",
     numTrees=500,
     maxDepth=3,
     seed = 1,
     featureSubsetStrategy="sqrt",
     impurity='gini')

model = rf.fit(bd_train)

end_time = time()
elapsed_time = end_time - start_time
print("Time to train model: %.3f seconds" % elapsed_time)
from pyspark.ml.classification import RandomForestClassifier
from time import time
start_time = time()
# Train a RandomForest model
rf = RandomForestClassifier(labelCol="label",
featuresCol="features",
numTrees=500,
maxDepth=3,
seed = 1,
featureSubsetStrategy="sqrt",
impurity='gini')
model = rf.fit(bd_train)
end_time = time()
elapsed_time = end_time - start_time
print("Time to train model: %.3f seconds" % elapsed_time)Time to train model: 731.722 seconds
Prediction and metrics
pred = model.transform(bd_test)

cm = pred.groupBy('label','prediction').count().sort('label','prediction')
print("Confusion matrix")
cm.show()

TN = cm.filter((cm.label == 0) & (cm.prediction == 0)).collect()[0][2] #True negative
FP = cm.filter((cm.label == 0) & (cm.prediction == 1)).collect()[0][2] #False positive
FN = cm.filter((cm.label == 1) & (cm.prediction == 0)).collect()[0][2] #Flase negative
TP = cm.filter((cm.label == 1) & (cm.prediction == 1)).collect()[0][2] #True positive

N=TN+FP+TP+FN

Prev = (TP + FN) / N
Sens = TPR = Recall = TP / (TP + FN)
Esp  = TN / (TN + FP) #= (1 - FPR)
Precision = PPV = TP / (TP + FP)
Acc = (TP+TN) / N

print("Metrics:")
print('Prevalence=',round(Prev,2))
print('Sensitivity=',round(Sens,2))
print('Especificity=',round(Esp,2))
print('Recall=',round(Recall,2))
print('Precision=',round(Precision,2))
print('Accuracy=',round(Acc,2))
pred = model.transform(bd_test)
cm = pred.groupBy('label','prediction').count().sort('label','prediction')
print("Confusion matrix")
cm.show()
TN = cm.filter((cm.label == 0) & (cm.prediction == 0)).collect()[0][2] #True negative
FP = cm.filter((cm.label == 0) & (cm.prediction == 1)).collect()[0][2] #False positive
FN = cm.filter((cm.label == 1) & (cm.prediction == 0)).collect()[0][2] #Flase negative
TP = cm.filter((cm.label == 1) & (cm.prediction == 1)).collect()[0][2] #True positive
N=TN+FP+TP+FN
Prev = (TP + FN) / N
Sens = TPR = Recall = TP / (TP + FN)
Esp = TN / (TN + FP) #= (1 - FPR)
Precision = PPV = TP / (TP + FP)
Acc = (TP+TN) / N
print("Metrics:")
print('Prevalence=',round(Prev,2))
print('Sensitivity=',round(Sens,2))
print('Especificity=',round(Esp,2))
print('Recall=',round(Recall,2))
print('Precision=',round(Precision,2))
print('Accuracy=',round(Acc,2))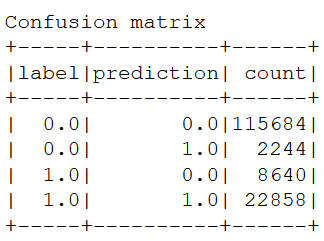
Metrics:
Prevalence= 0.21
Sensitivity= 0.73
Especificity= 0.98
Recall= 0.73
Precision= 0.91
Accuracy= 0.93
Accuracy is high with few variables because "Departure delay" is included as input variable. When starts goes wrong, ends bad.
ROC curve
from pyspark.sql.functions import udf
from pyspark.sql.types import FloatType

secondelement=udf(lambda v:float(v[1]),FloatType())
pred2=pred.withColumn('probs',secondelement('probability'))

import matplotlib.pyplot as plt
from sklearn.metrics import roc_curve
import seaborn as sns

pd5 = pred2.sample(False,0.1).select('label','probs').toPandas()

fpr, tpr, _ = roc_curve( pd5['label'], pd5['probs'])

plt.plot(fpr, tpr)
plt.plot([0, 1], [0, 1], color='navy', linestyle='--')
plt.xlabel('1 - Esp (FPR)')
plt.ylabel('Sens (TPR)')
plt.title('Curva ROC')
plt.show()
from pyspark.sql.functions import udf
from pyspark.sql.types import FloatType
secondelement=udf(lambda v:float(v[1]),FloatType())
pred2=pred.withColumn('probs',secondelement('probability'))
import matplotlib.pyplot as plt
from sklearn.metrics import roc_curve
import seaborn as sns
pd5 = pred2.sample(False,0.1).select('label','probs').toPandas()
fpr, tpr, _ = roc_curve( pd5['label'], pd5['probs'])
plt.plot(fpr, tpr)
plt.plot([0, 1], [0, 1], color='navy', linestyle='--')
plt.xlabel('1 - Esp (FPR)')
plt.ylabel('Sens (TPR)')
plt.title('Curva ROC')
plt.show()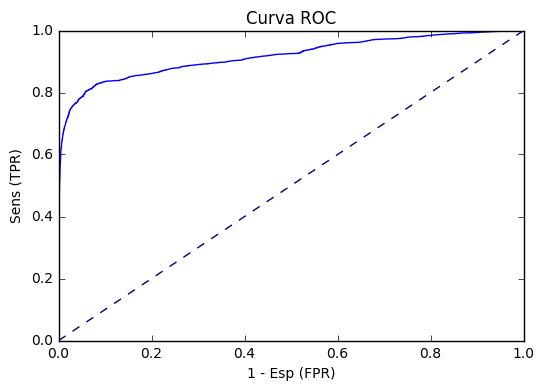
Calculating AUC (Area under corve)
from pyspark.ml.evaluation import BinaryClassificationEvaluator as BCE

print('AUC=',BCE(metricName="areaUnderROC",rawPredictionCol = 'probability').evaluate(pred))
from pyspark.ml.evaluation import BinaryClassificationEvaluator as BCE
print('AUC=',BCE(metricName="areaUnderROC",rawPredictionCol = 'probability').evaluate(pred))AUC= 0.9216734552356558
I hope it will be useful for you and thanks for sharing!
Home